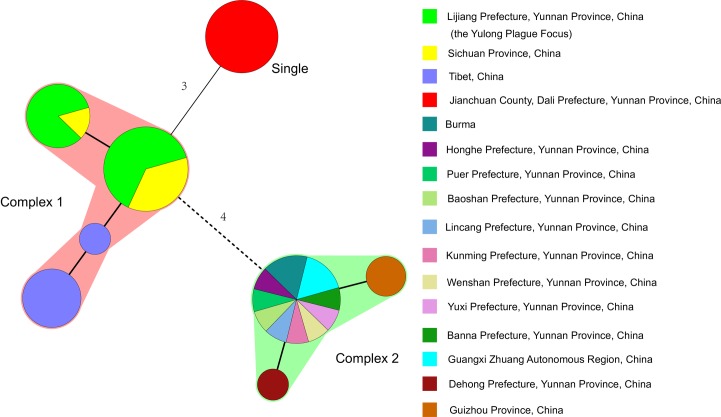
Fig 2. Minimum spanning tree analysis of DFR & CRISPR to Yersinia pestis strains in the Yulong plague focus and its surrounding areas.
A minimum spanning tree was constructed using the DFR and CRISPR genotyping data (S1 Table). The DFR and CRISPR types are displayed as circles, and the size of the circle indicates the number of isolates with the particular type. Thick solid lines connect types that differ in a single locus, thin solid lines connect types that differ in 3 loci, and dashed lines connect types that differ in 4 loci. If 2 neighboring types do not differ in more than 1 locus, they are surrounded by a halo of the same color and form a complex.

