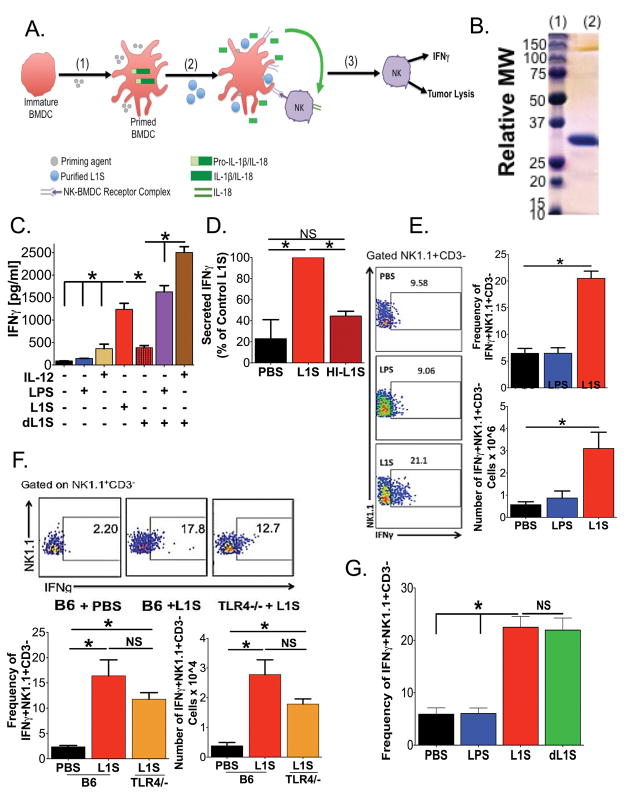
Figure 1. Treatment with L1S Protein Stimulates BMDCs to Induce Natural Killer Cell Activation.
(A) Model depicting the presumed mechanism for NK cell activation, based on Schmidt et al23: (1) Priming of immature BMDC induces production of pro-cytokines. (2) L1S treatment elicits inflammasome-dependent cytokine processing and promotes cell-contact-dependent NK cell activation. (3) Activated NK cells produce IFNγ and show increased cytolytic function. (B) Representative coomassie-stained SDS-PAGE with (lane 1) mass marker and (lane 2) 10 ug of purified L1S protein. (C) Supernatant IFNγ was quantified 24 h after establishing co-cultures of BMDC and NWNA cells (both from B6 mice). BMDC were treated with the indicated priming agent ± 30 ug/ml recombinant L1S. L1S was purified using nickel (Ni) affinity chromatography alone. Detoxified (d)L1S was further purified using a polymixin B column to remove LPS. (N=3) (D) Relative abundance of supernatant IFNγ 24 h after treatment of co-cultured LPS-primed BMDC and NWNA cells with PBS ± purified control or heat-inactivated (HI) L1S protein. (N=3) (E) Intracellular staining for IFNγ+ in gated NK1.1+CD3− cell populations isolated from lungs of B6 mice 24 h after instillation of PBS ± 125 ng LPS or 125 ug L1S (N=7). (F) Intracellular staining for IFNγ+ in gated NK1.1+CD3− cell populations from lungs of B6 and B6.tlr4−/− mice 24 h after instillation of PBS or 125 ug L1S (N=3). (G) Intracellular staining for IFNγ+ in gated NK1.1+CD3− cell populations isolated from lungs of B6 mice at 24 h after instillation of PBS ± 125 ng LPS, 125 μg L1S or 125 μg of dL1S (N=4). For E, F and G, representative plots are shown gated on Live → singlets →→ NK1.1+CD3− → IFNγ+. For all graphs data were pooled from the indicated number of experiments using at least 3 cultures or mice per group per experiment. Errors are SEM. (*) indicates p < 0.05 using ANOVA with Newman-Keuls comparison.

