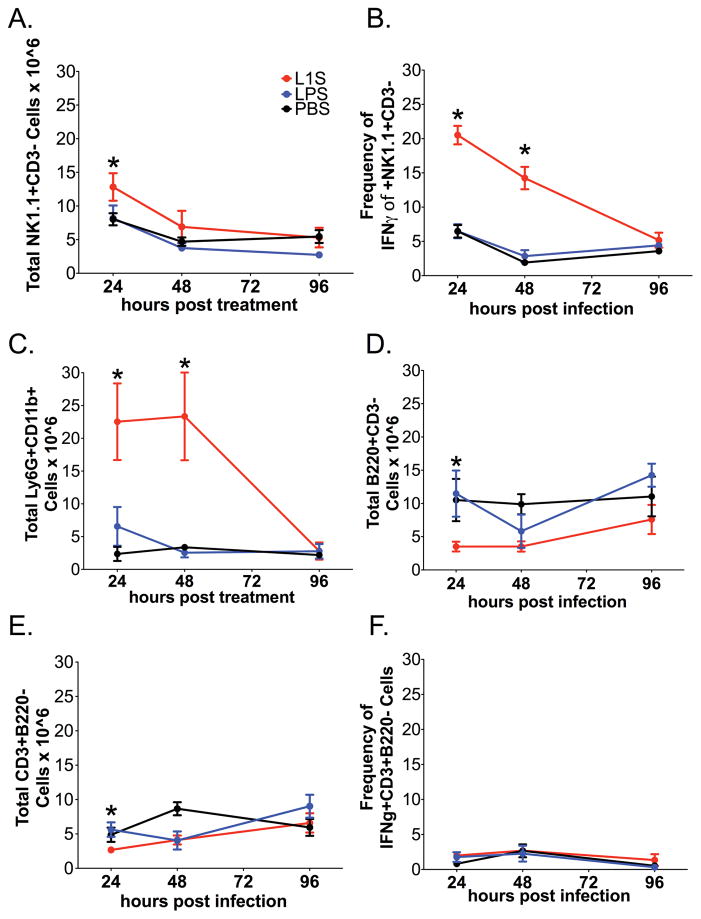
Figure 2. Kinetics of inflammatory cell accumulation and activation in lungs of naïve mice treated with L1S.
As above, mice received a single i.t. instillation with PBS ± L1S protein or LPS. At the indicated times, lungs were harvested and single cell suspensions prepared for flow cytometry analysis. (A) NK cell (NK1.1+CD3−) number per lung. (B) Proportion of activated NK cells (NK1.1+CD3−) as measured by intracellular staining for IFNγ+NK1.1+CD3−. (C) Neutrophil (Ly6G+CD11b+) number per lung. (D) B cell number per lung (B220+CD3−). (E) T cell (CD3+B220−) number per lung. (F) Proportion of T cells (CD3+B220−) staining positive for intracellular IFNγ+ at indicated time. Each data point represents data pooled from at least 3 experiments with at least 3 mice per experiment. Cells are gated on Live → singlets → Respective group(s) of interest. Error bars indicate SEM. (*) indicates p < 0.05 using ANOVA with Newman-Keuls comparison.

