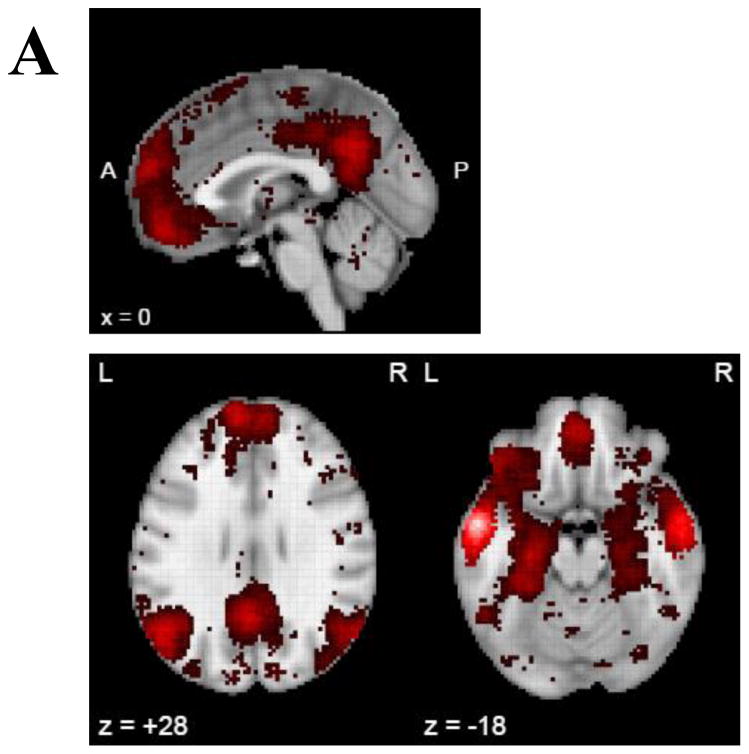
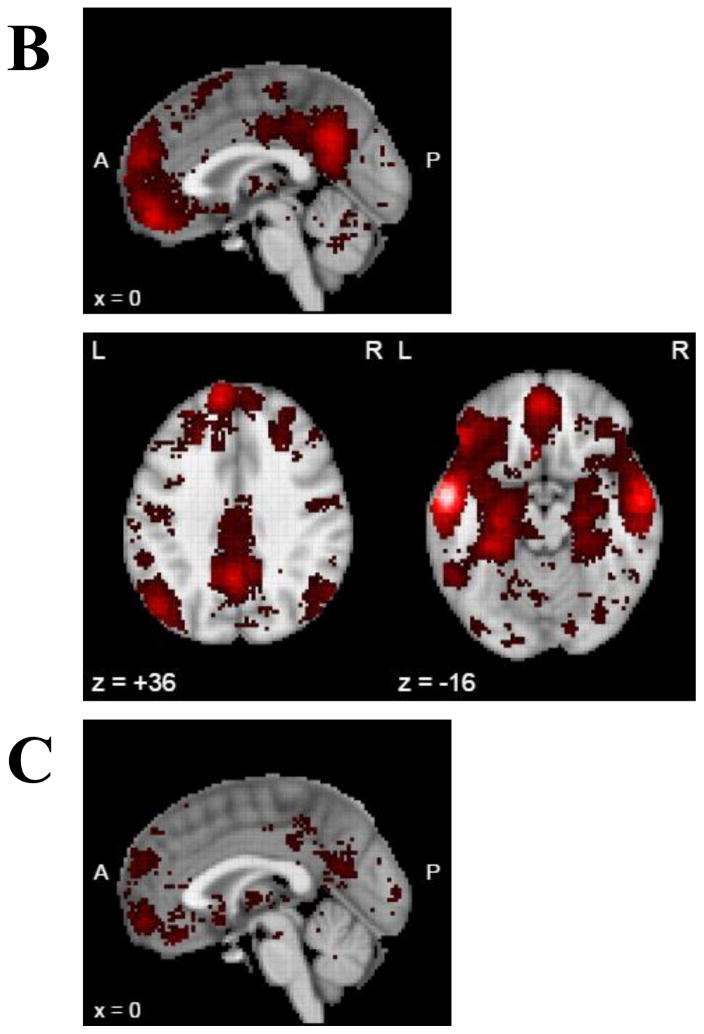
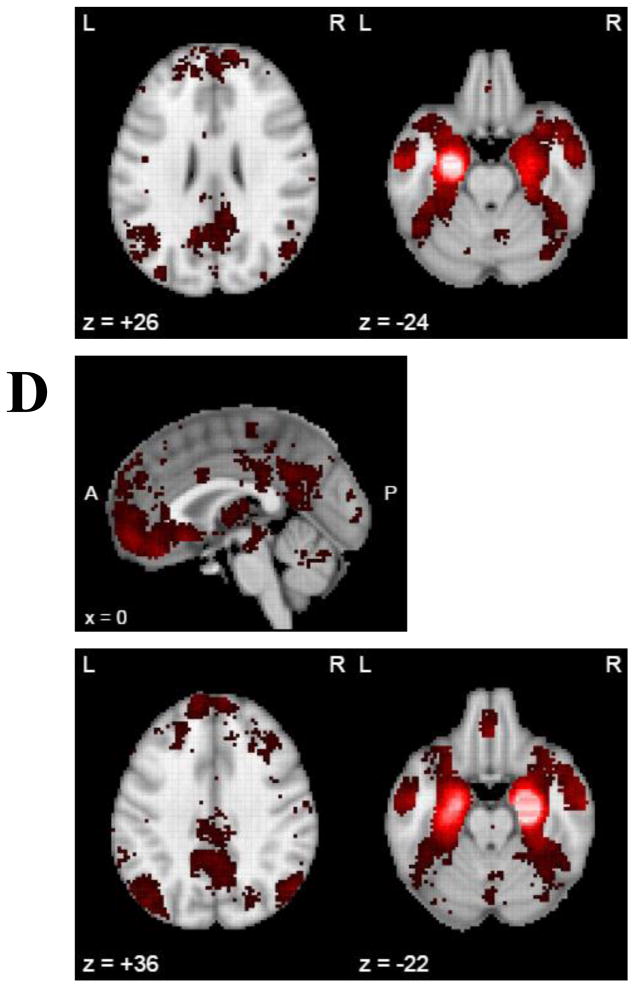
Figure 4.
Neurosynth co-activation meta-analysis of MTG and EC, thresholded at false discovery rate criterion of p < .05. Neurosynth had 11,406 studies, 150,000 brain locations, and 413,429 activations at time of analysis (April 18th, 2017). Red activation represents positive co-activation with seed region (white corresponds with the seed). No negative co-activation was found in any of the analyses completed. Maps show co-activation of the following seed regions: A) left middle temporal gyrus; B) right middle temporal gyrus; C) left entorhinal cortex D) right entorhinal cortex.


