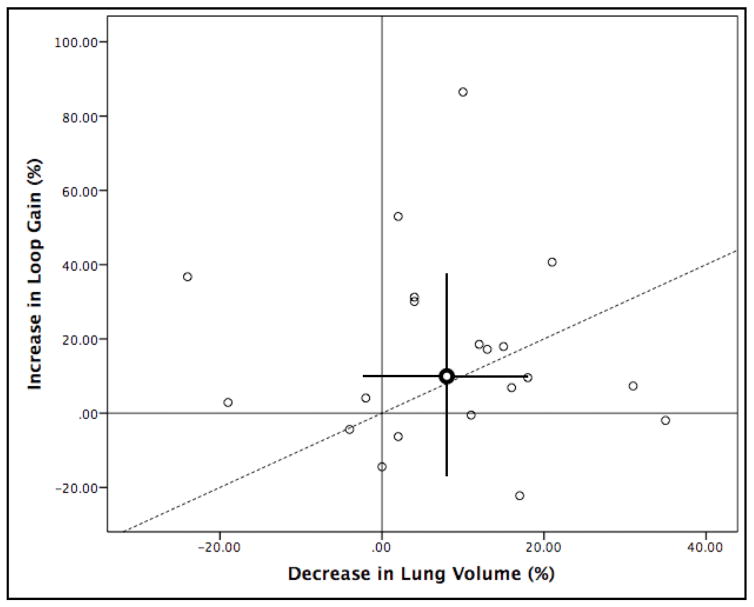
Figure 3.
Relationship between percent increase in loop gain versus percent decrease in lung volume with change from lateral to supine sleeping position. Bold data point is the mean change in loop gain and lung volume with error bars representing the standard deviation vertically for loop gain and horizontally for lung volume. Dashed line is the line of identity.

