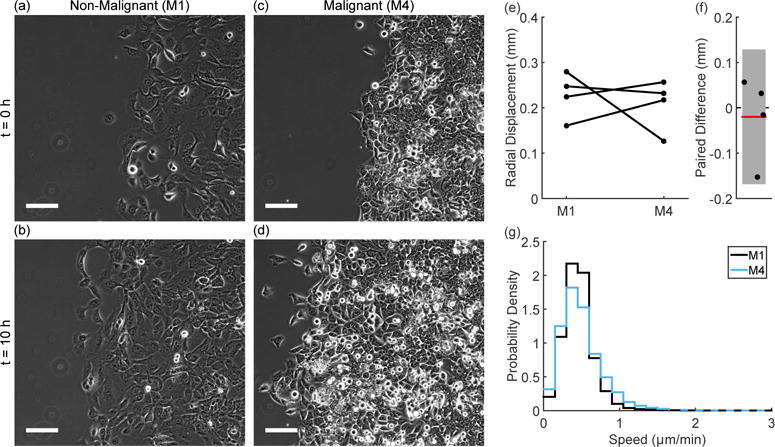
Figure 1.

Phase contrast images of the non-malignant M1 cells (a; b) and the malignant M4 cells (c; d) show the radial migration assay at t = 0h (a; c) and t = 10h (b; d). These images are taken from Supplemental Movie 1. In all images, the scale bar indicates 100 μm. The absolute value of radial displacement varies (e), but paired experiments show no trend in the difference between M1 and M4 cells (f, error bar indicates 95% confidence interval). The speed distributions (cumulative over time and space) within the monolayer (cumulative from N = 4 experiments) show similar mean speeds, but the M4 distribution shows a longer high speed tail (g). Dashed lines indicate the region where the two curves overlap.
