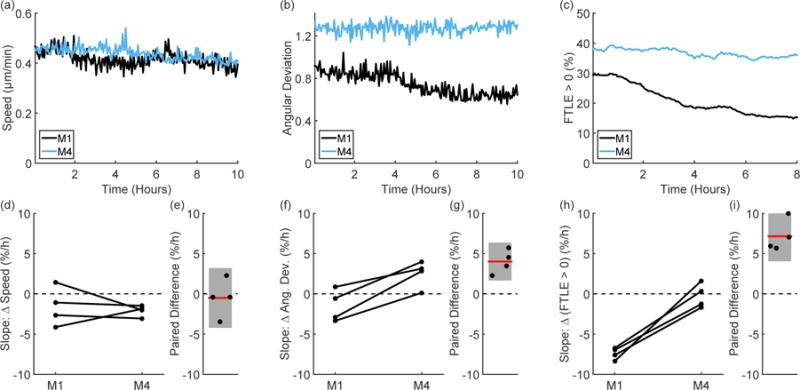
Figure 3.

Representative time traces of speed (a), angular deviation (b), and FTLE values (c) from paired experiments show differences in the migration phenotype of the M1 and M4 cells. As shown by looking at the slope of speed over time (d), there is no trend in the difference between the M1 and M4 cells (e). However, the slope of angular deviation over time (f) tends to be higher in the M4 cells than in the M1 cells (the paired difference is shown in (g)). This is consistent with the trend seen in the FTLE values (h), where the M1 cells show a negative slope over time, while the M4 cells hold a fairly constant FTLE value over time and show a strong difference from the M1 cells (i). Lines in (d; f; h) pair experiments performed on the same day and error bars in (e; g; i) indicate 95% confidence intervals.
