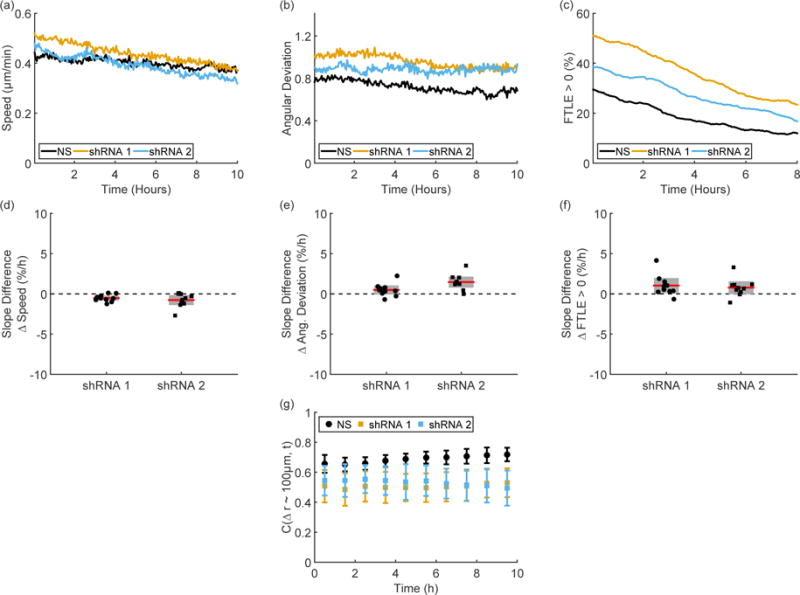
Figure 6. M1 E-cadherin shRNA cells.

Representative time traces of speed (a), angular deviation (b), and FTLE values (c) from paired experiments show some changes between the nonsense (NS) and E-cadherin shRNA knockdown cell types but no changes in long time behavior. As shown by the experimentally paired differences between knockdown and NS in the slopes of speed (d), angular deviation (e), and FTLE values (f), there is no change in long time trends after E-cadherin knockdown. Although the E-cadherin shRNA cell lines show decreased correlations values compared to the NS cell line, the correlations are stable for each cell type, as shown by the correlations in the region 90 μm < Δr < 105 μm (g). Error bars in (d – g) indicate 95% confidence intervals.
