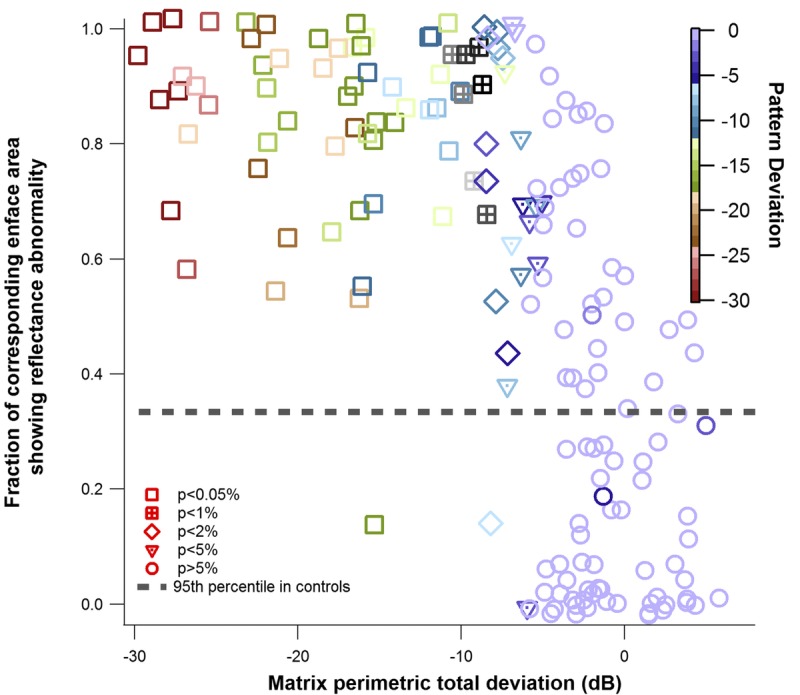
FIGURE 7.

Local comparison of perimetric findings and reflectance findings, in the patients with glaucoma. Total deviation (TD) of Matrix perimetric testing plotted against the corresponding enface area showing reflectance abnormality. Small amounts of random noise were added to the x-axis and y-axis to differentiate identical points. The color of the marker indicates the pattern deviation (PD). The shape of the marker indicates the P value assigned to the total deviation measure, based on the perimetric machine norms.
