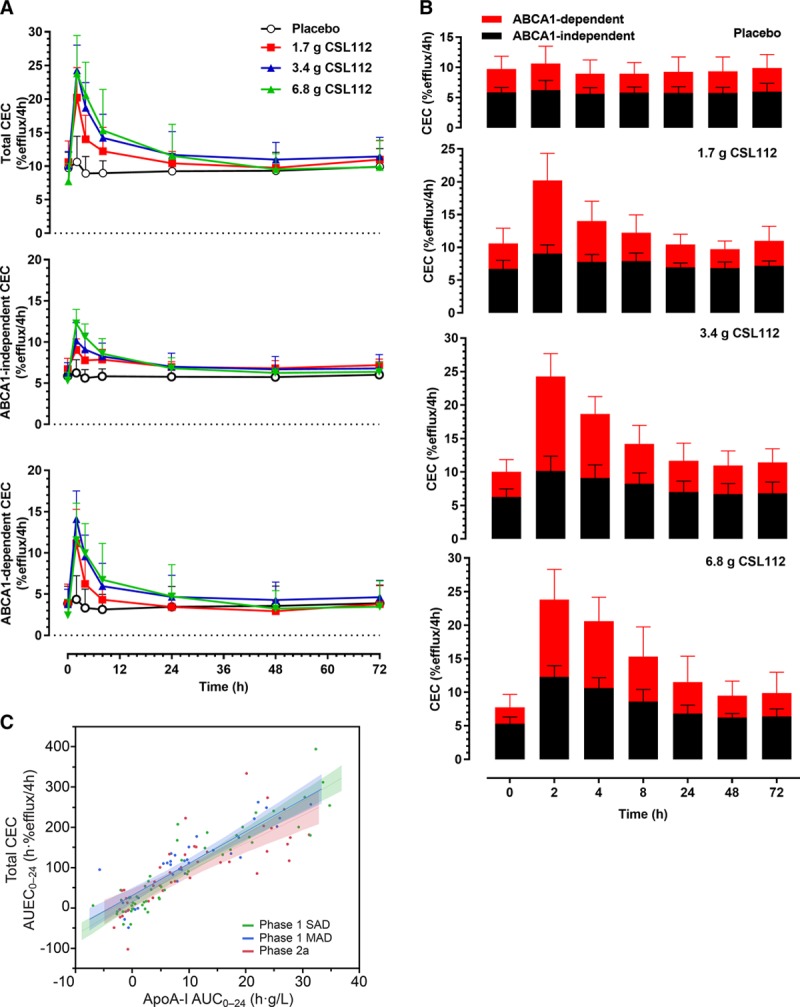
Figure 4.

Cholesterol efflux capacity (CEC) after infusion of CSL112. A, Shown are time courses (mean+SD) of total CEC (measured in J774 macrophages in presence of cAMP), ATP-binding cassette transporter 1 (ABCA1)–independent CEC (measured in J774 macrophages in absence of cAMP), and ABCA1-dependent CEC (calculated as the difference of ABCA1-independent and total CEC). B, Shown are the contributions of ABCA1-dependent and ABCA1-independent efflux to total CEC, by dose group (means+SD). C, The relationship of baseline-corrected apolipoprotein A-I (apoA-I) exposure (area under the curve 0−24 h [AUC0−24]) and baseline-corrected total cholesterol efflux exposure (area under the effect curve 0−24 h [AUEC0−24]) is shown in healthy volunteers (phase 1 single ascending dose [SAD] and multiple ascending dose [MAD] studies) and in a phase 2a study in stable atherosclerotic disease for comparison. Shown are linear regression lines and 95% CIs for each study, calculated using a random effects regression model with patient as the random effect and testing the parallelism of slopes hypothesis (difference in slopes, P=0.1).
