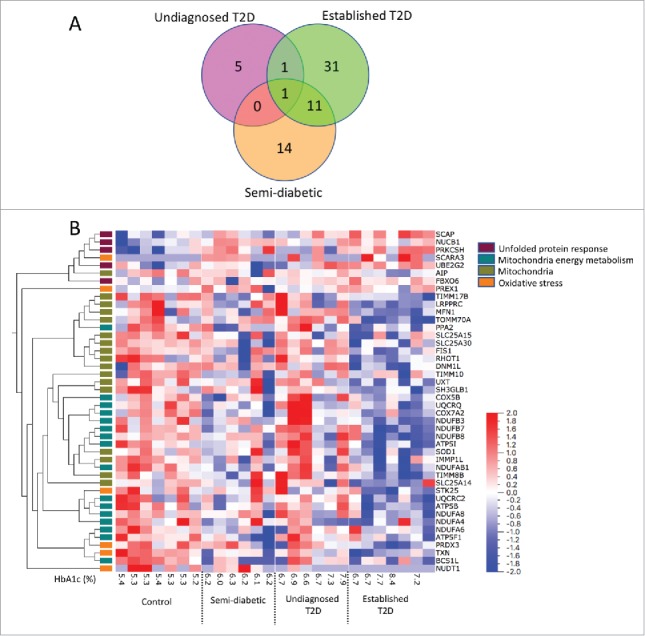
Figure 3.

Differentially expressed genes in the different donor groups compared to controls. In (A) a Venn diagram shows the number of differentially expressed genes (p<0.05) in each donor group compared to the control group. In (B) a heat map and hierarchical clustering of the 42 genes differentially expressed in islets from donors with established T2D compared with islets from control donors (p < 0.05) is shown. Samples are ordered by group and genes by hierarchical clustering based on their expression in all samples across all four donor groups (average linkage method). Genes are labelled by the pathway-focused array on which they were analyzed. The false discovery rate is <0.30 and individual FDR Q values are shown in Supplementary Table S1.
