
Figure 1.
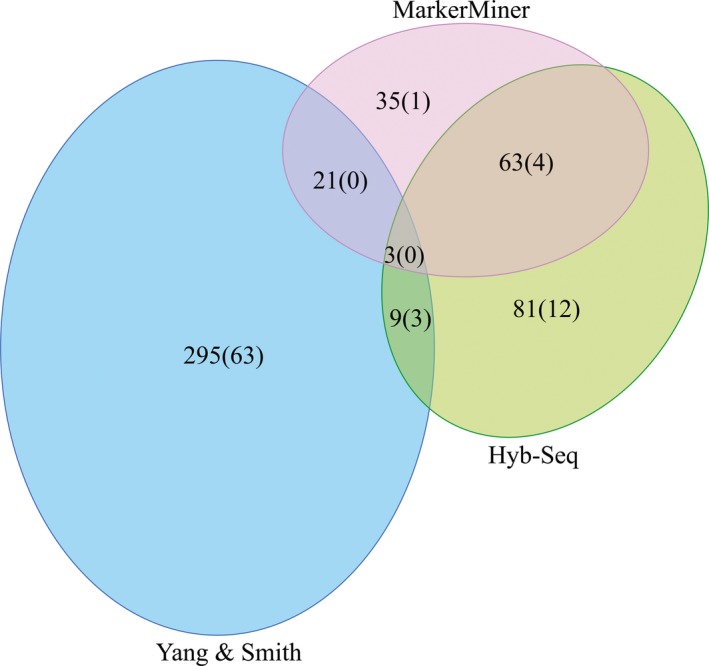
A proportional Venn diagram showing the contribution of different methods for targeted loci set development. Numbers in parentheses are the number of putatively paralogous loci from each method obtained from the recovered target enrichment loci.