
Figure 7.
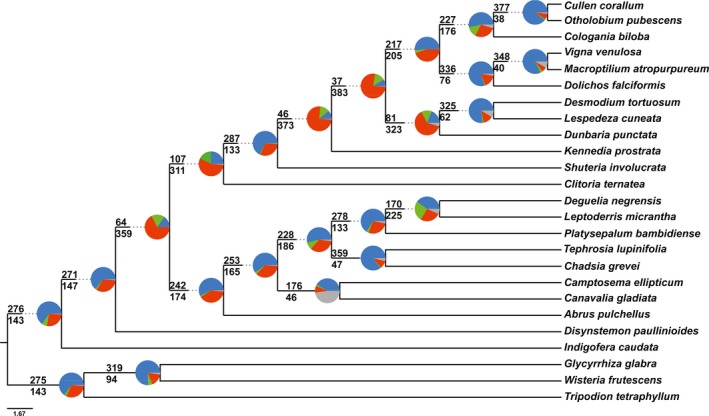
ASTRAL species tree based on 423 gene trees with a summary of conflicting and concordant homologs. For each branch, the number of homologs concordant (top) or in conflict (bottom) with the species tree at each node is indicated. Pie charts at each node present the proportion of homolog support for that clade (blue), the main alternative (green), the remaining alternatives (red), and the proportion that inform (conflict or support) this clade that have less than 50% bootstrap support (gray).