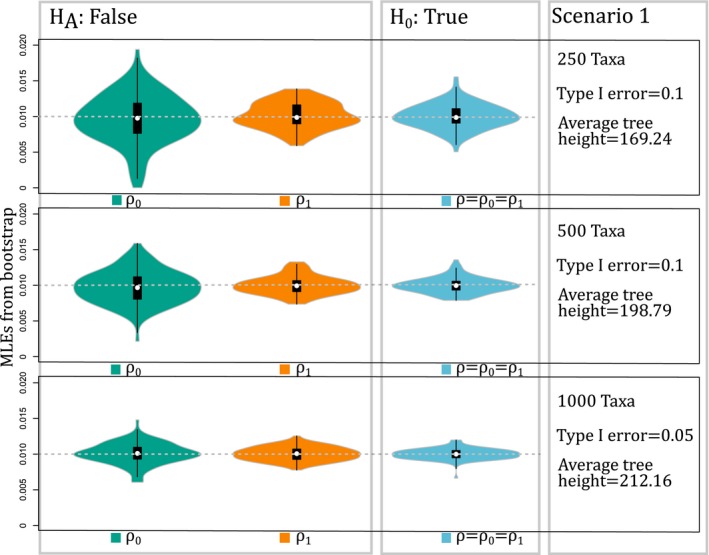
Figure 1.

Results of simulations for Scenario 1 using chromploid with the BiChroM model. In Scenario 1, the null hypothesis is true, and it was simulated for trees with 250, 500, and 1000 taxa (shown vertically). An increase in the number of taxa decreases type I error when increasing from 500 to 1000 taxa, and violin plots show a decrease in the variance of the maximum likelihood estimates that are centered at the true value of simulation 0.01 (dotted gray line).
