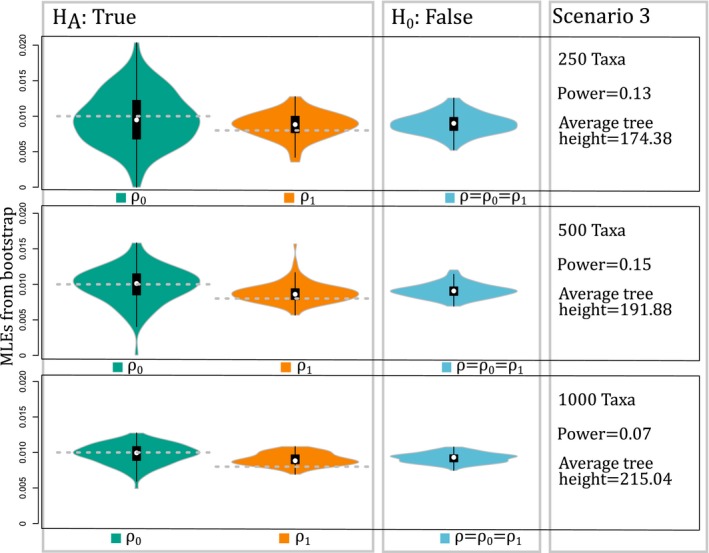
Figure 3.

Results of simulations for Scenario 3. Estimates show that the likelihood ratio test has low power, and the power does not increase with more taxa. Increasing taxa reduces the variance of estimates, but not sufficiently for the violin plots to distinguish between the two parameters.
