
Figure 7.
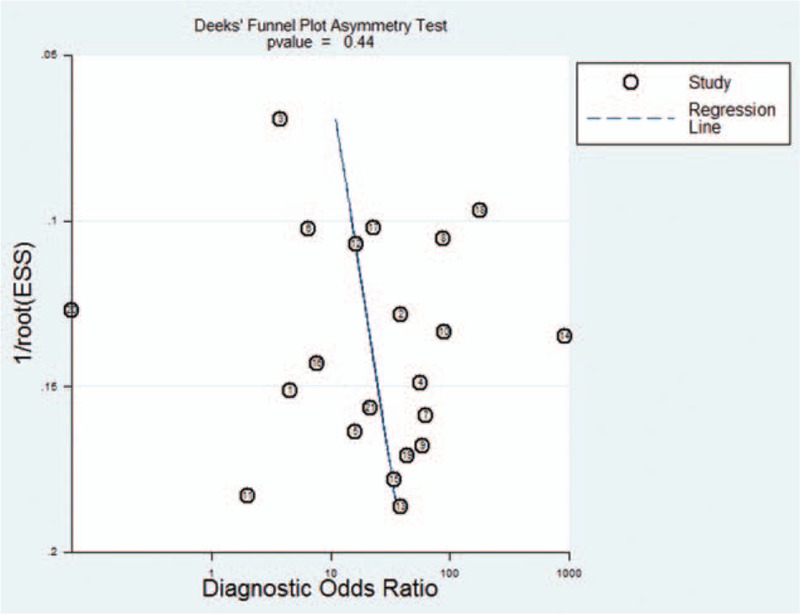
Funnel plot for evaluating publication bias among the 18 studies included in the meta-analysis. The log of the DOR is plotted against the standard error of the log DOR; the latter serves as an indicator of the sample size. Each article is shown as a solid circle, and the regression line is shown.