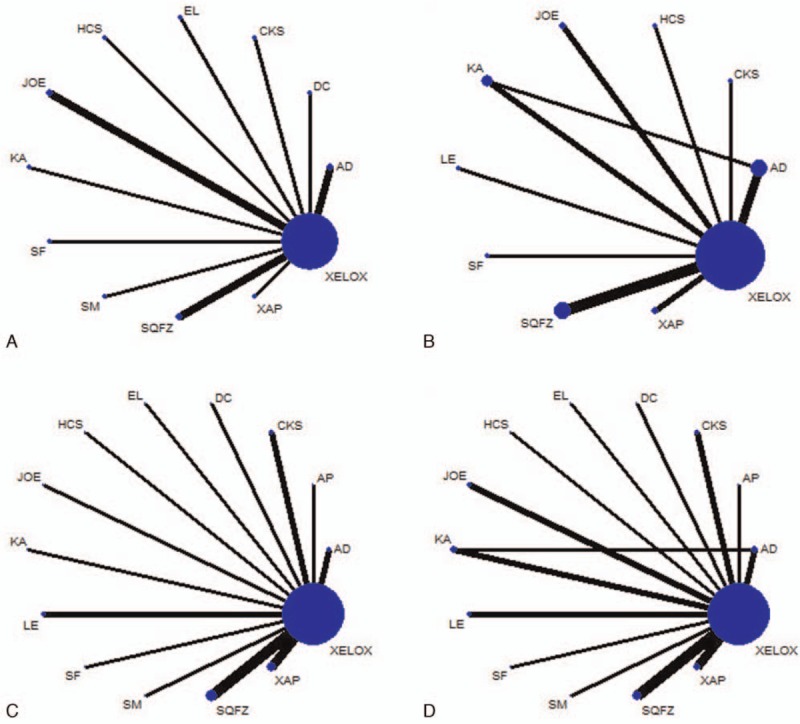
Figure 2.

Network graph for 4 outcomes in this network meta-analysis. Note: (A) The clinical effectiveness rate; (B) performance status; (C) leucopenia; (D) nausea and vomiting. Node sizes indicate total sample sizes for treatments. Line thicknesses correspond to the number of trials used for comparisons.
