Figure 6.

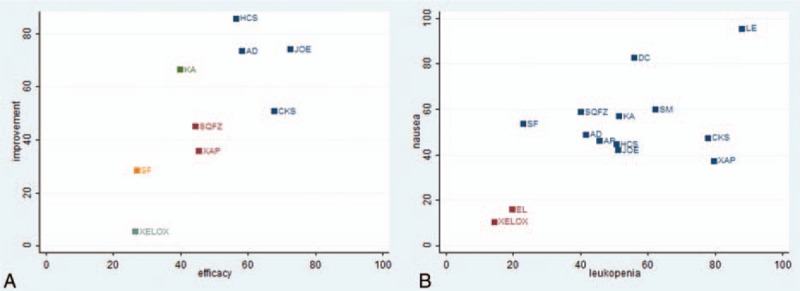
Cluster analysis plots of 4 outcomes. Note: (A) The clinical effectiveness rate and performance status (X-axis: the clinical effectiveness rate; Y-axis: performance status); (B) ADRs (X-axis: leukopenia; Y-axis: nausea and vomiting.).

Cluster analysis plots of 4 outcomes. Note: (A) The clinical effectiveness rate and performance status (X-axis: the clinical effectiveness rate; Y-axis: performance status); (B) ADRs (X-axis: leukopenia; Y-axis: nausea and vomiting.).