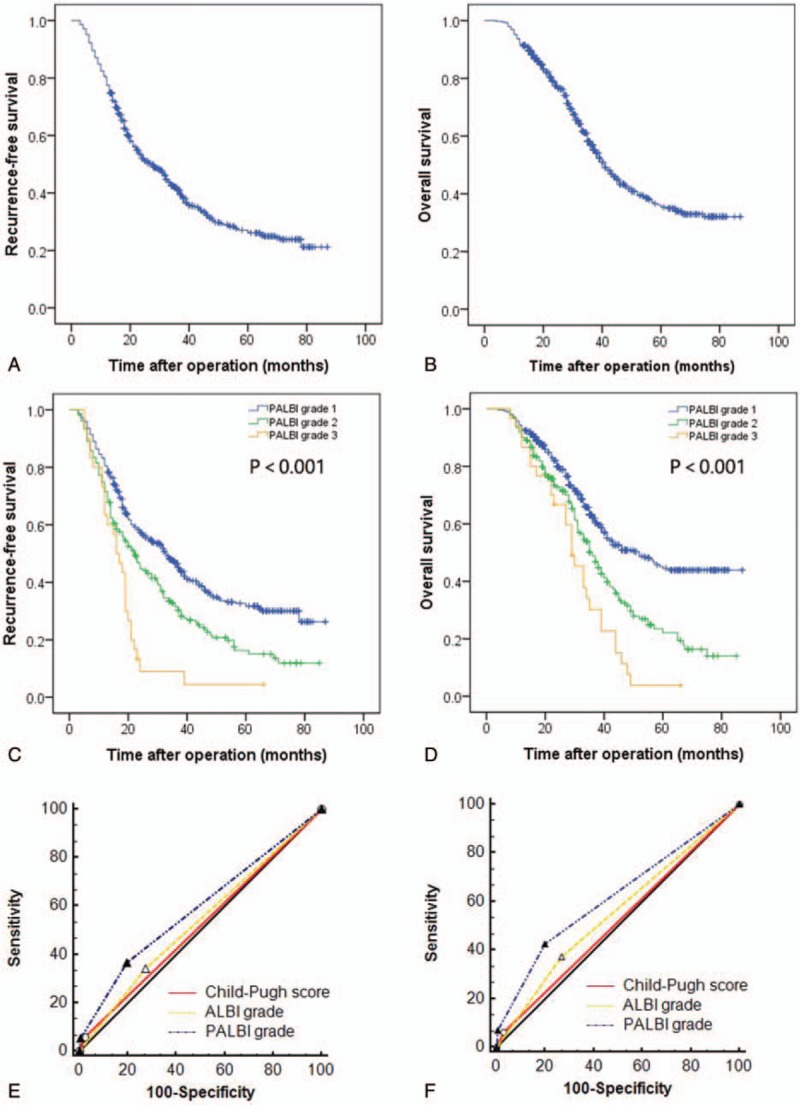
Figure 1.

The RFS (A) and OS (B) curves for the whole cohort; comparison of RFS (C) and OS (D) in patients with different PALBI grades; comparison of the AUC for the PALBI grade, ALBI grade and Child–Pugh score in predicting RFS (E) and OS (F). AUC = area under the receiver operating characteristic curve, OS = overall survival, PALBI = platelet-albumin–bilirubin, RFS = recurrence-free survival.
