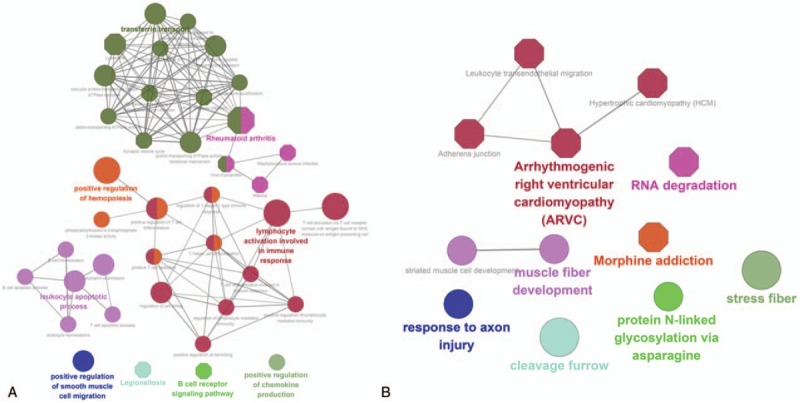
Figure 1.

The enrichment analysis of up- and downregulated DEGs in GO biological process and KEGG pathway. (A) Upregulated genes, (B) downregulated genes. Roundness nodes represent GO biological process classification; hexagon nodes represent KEGG pathway classification; different color nodes represent different pathway/GO biological process classification. DEG = differentially expressed gene, GO = Gene Ontology, KEGG = Kyoto Encyclopedia of Genes and Genomes.
