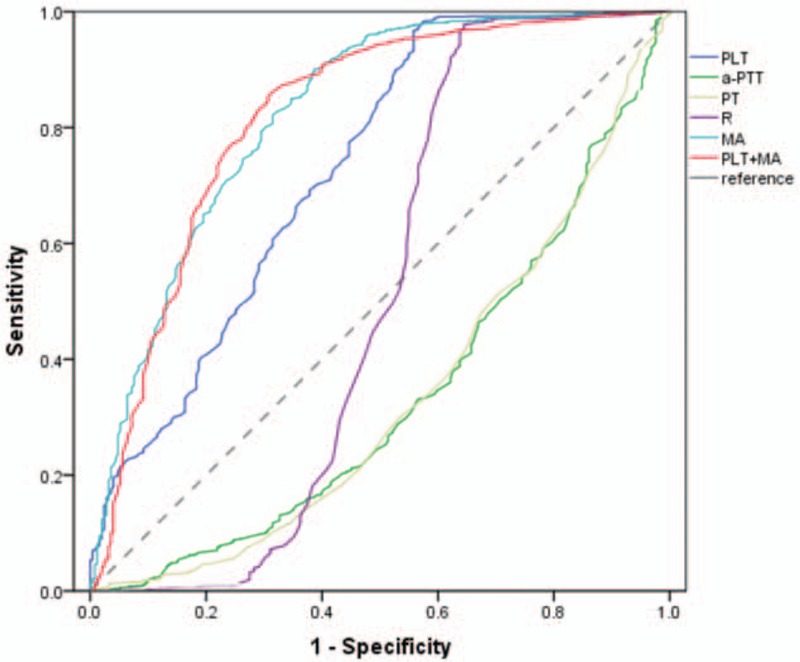
Figure 1.

The predictive value of PLT, aPTT, PT, R, MA, and PLT+MA for bleeding risk assessed by ROC curve analysis in patients with leukemia. aPTT = activated partial thromboplastin time, MA = maximum amplitude, PLT = total platelet count, PT = prothrombin time, R = reaction time.
