
Figure 3.
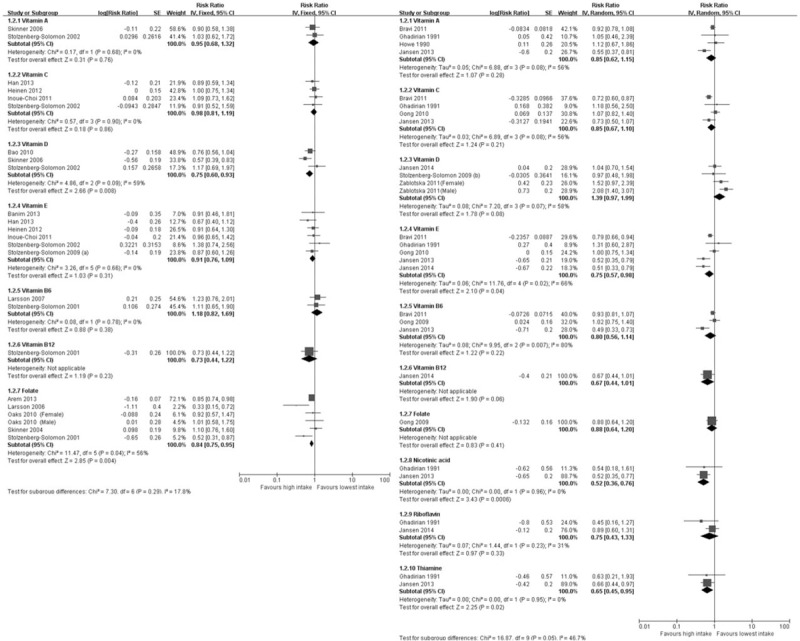
Forest plot of dose–response meta-analysis. Squares or diamonds to the left of the solid vertical line indicate benefit with vitamin intake. Left forest plot indicates prospective studies and the right one indicates retrospective studies.
Official websites use .gov
A
.gov website belongs to an official
government organization in the United States.
Secure .gov websites use HTTPS
A lock (
) or https:// means you've safely
connected to the .gov website. Share sensitive
information only on official, secure websites.
Forest plot of dose–response meta-analysis. Squares or diamonds to the left of the solid vertical line indicate benefit with vitamin intake. Left forest plot indicates prospective studies and the right one indicates retrospective studies.