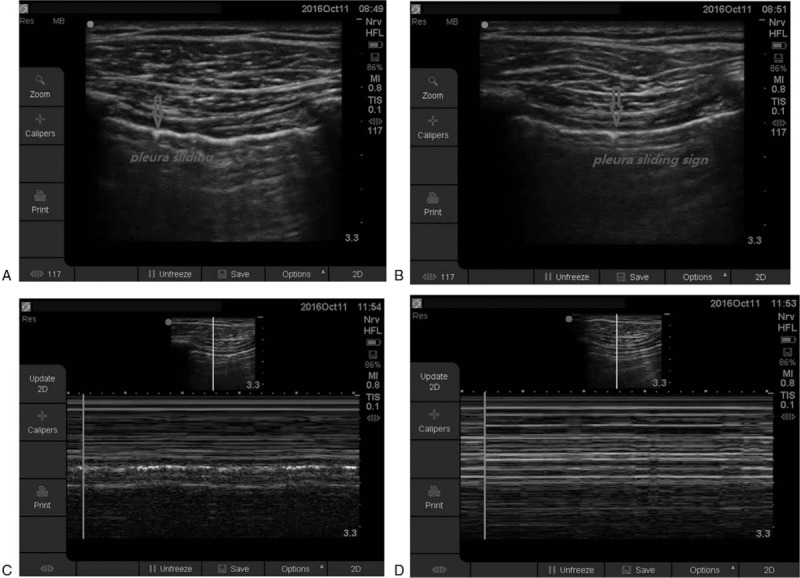
Figure 2.

A and B: Pleura sliding sign were shown in these 2 pictures. In picture A, the point indicated by the red arrows showed one point of the pleura at the end of the expiratory. In picture B, this point was sliding to another location next to it at the end of respiratory. The 2 pictures clearly showed how the pleura sliding sign happened. C and D: Lung ventilations were shown in the ultrasound by the M model. In picture C, signs were seen which indicated there were ventilation under the probe. Barcode signs were seen in picture D, which indicated there was no ventilation under the probe. That means, if there were pleura sliding signs, lung ventilation were true under the probe, and beach signs will be seen clearly when using the M mode. M mode ultrasound was a good supplement in our study besides the sliding signs.
