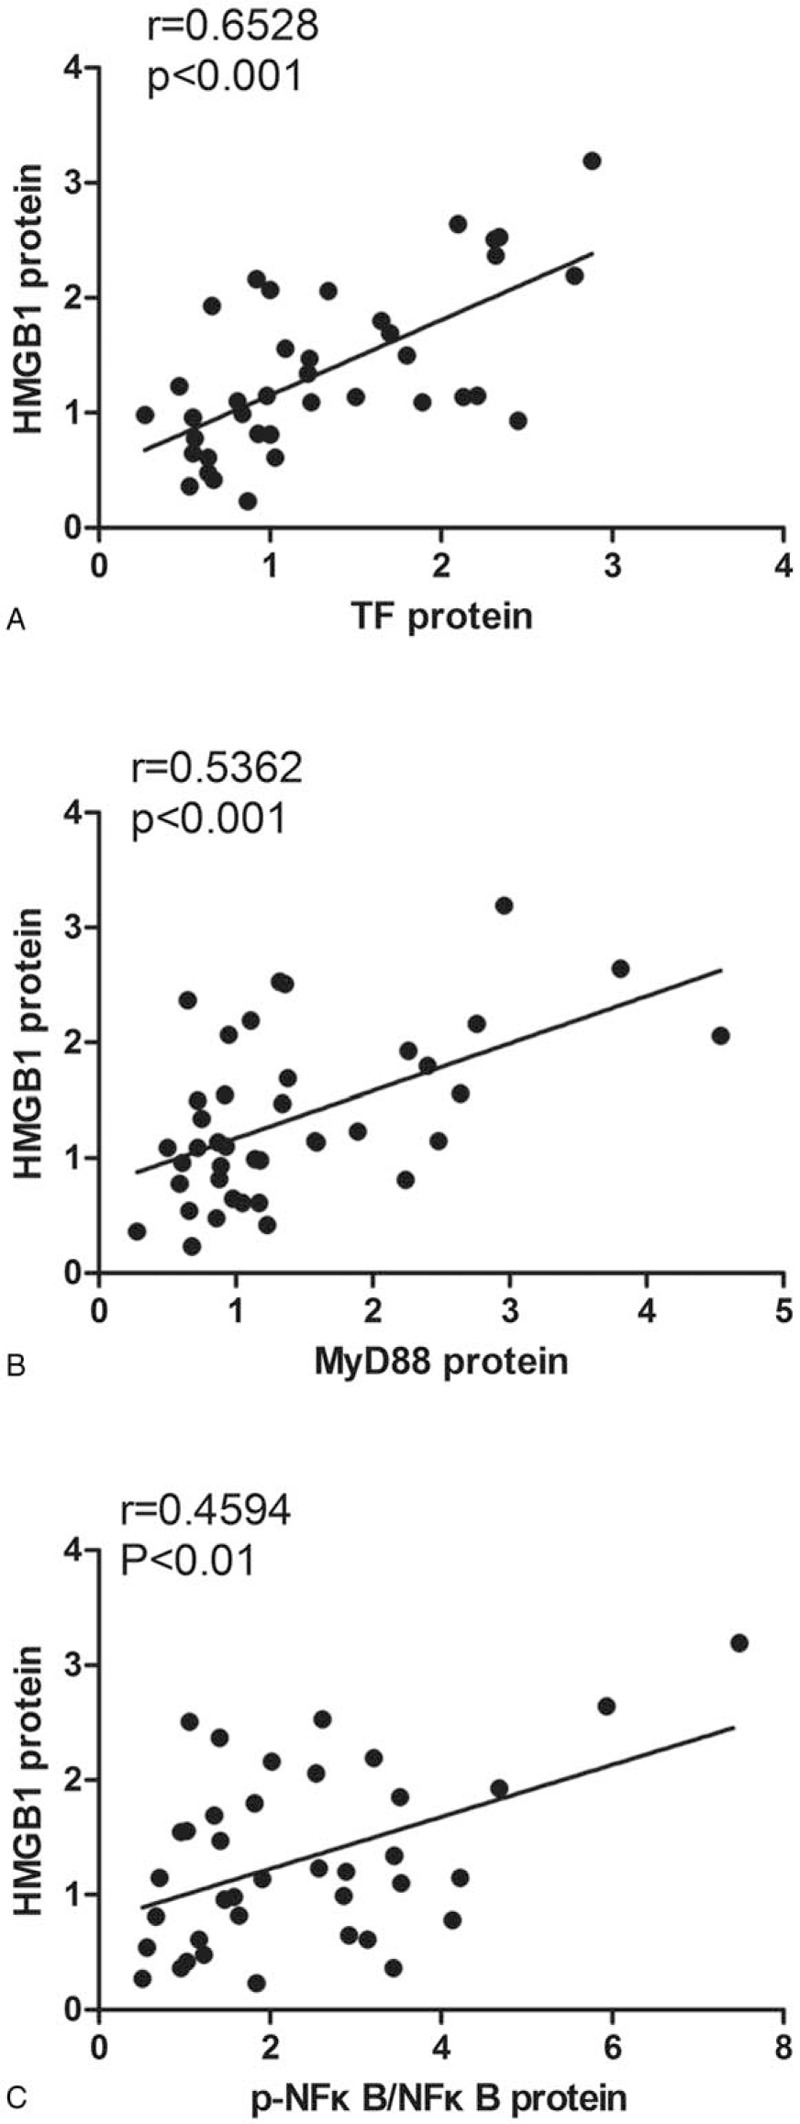
Figure 3.

Linear correlation analyses between HMGB1 and other parameters. (A) Relationship between protein expression of TF and HMGB1 (r = 0.6528, P < .001, n = 45). (B) Relationship between protein expression of MyD88 and HMGB1 (r = 0.5362, P < .001, n = 45). (C) Relationship between protein expression of p-NFκB/NFκB and HMGB1 (r = 0.4594, P = .0037, n = 45). AF = atrial fibrillation, HMGB1 = high mobility group box 1, MyD88 = myeloid differentiation factor 88, T = thrombus, TF = tissue factor.
