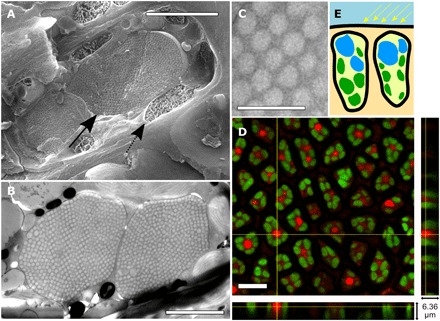
Fig. 2. Structure and composition of OPCs.

(A) Cryo-SEM image of an epidermal cell. Scale bar, 2 μm. Arrows indicate OPC (solid) and chloroplast (dashed) positions within the cell. (B) Cross section of a single epidermal cell (TEM image). Scale bar, 2.5 μm. (C) Nanospheres in quasi–close-packed configuration. Scale bar, 1 μm. (D) False-color fluorescence confocal images of epidermal cells for chlorophyll (green) and Nile red lipophilic dye (red). Scale bar, 10 μm. (E) Sketch of position for OPCs (blue) and chloroplast (green) within the epidermal cells.
