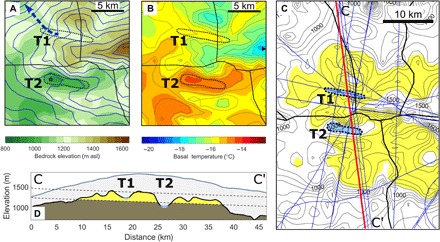
Fig. 2. Basal temperature, hydraulic head, and projected salt-bearing outcrops beneath DIC.

(A) Bedrock elevation overlain with the hydraulic head (blue) and ice divides (black). The blue star indicates the location of the hydraulic head minimum in T2, whereas the arrow indicates the direction of water potentially outflowing T1. (B) Bedrock elevation contours overlain with modeled basal temperatures. The black triangle is the location of the ice temperature profile, where a basal temperature of −18.5°C was measured (26). (C) The area where the Bay Fiord Formation containing the bedded salt sequence is projected to outcrop beneath the ice is marked in yellow. Radar profiles are marked in blue/red. (D) Cross-section along radar transect CC′, revealing the projected geology consisting of the Bay Fiord Formation (yellow) and underlying sedimentary rocks (brown).
