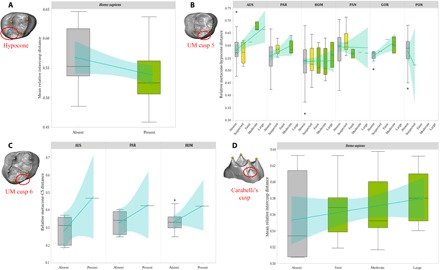
Fig. 2. Accessory cusp expression of hominoid upper molars.

Box plots of relative intercusp distance by degree of expression for the hypocone (A) in H. sapiens and for cusp 5 (B), cusp 6 (C), and Carabelli’s cusp (D) in hominoids (generic analysis for Carabelli’s cusp in fig. S1). Line of fit and 95% confidence intervals are shown in light blue for visualization of trends only. The PCM predicts a negative relationship between trait expression and mean intercusp distance for the hypocone and Carabelli’s cusp and a positive relationship between trait expression and expanded intercusp distance for cusps 5 and 6. For box plots, cusp absence is in gray, cusp “suspected” is in yellow, and cusp presence is in green. Cusp analyzed in each box plot is circled in red, and landmarks used to calculate intercusp distance are in yellow. Genera are not depicted if the accessory cusp was invariably absent/present in our sample. The asterisk indicates outliers. UM, upper molar.
