
Fig. 3. Scatterplots of VOC concentrations with NOy concentration.
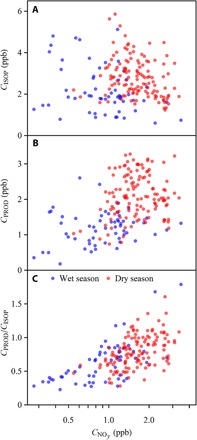
(A) Isoprene concentration CISOP. (B) Sum concentration CPROD of isoprene oxidation products. (C) Concentration ratio CPROD/CISOP. Data points represent hourly averages recorded within a time window of 13:00 to 16:00 (local time) (17:00 to 20:00 UTC). Blue and red points correspond to the wet and dry seasons, respectively, for fair-weather conditions. All weather data, including periods of heavy rainfall or prolonged overcast conditions, are presented in fig. S1.