
Fig. 4. Simulated dependence of the concentration ratio CPROD/CISOP on NOy concentration .
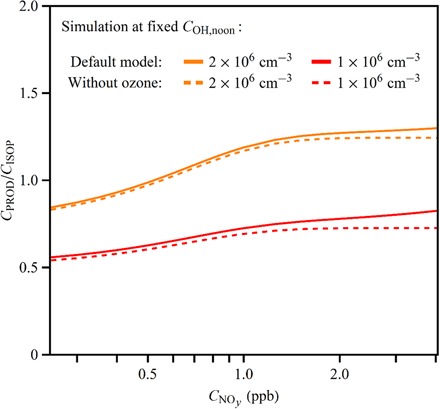
Results are shown for two different values of COH,noon, as well as the full model compared to a model that omitted isoprene ozonolysis. At fixed COH,noon, affects CPROD/CISOP via the effects on and (CNOy) (Eq. 5). Solid lines show results for the full model of Eq. 5, and dashed lines show results for a model that omits isoprene ozonolysis (that is, = 0). For all cases, t = 8.5 hours, corresponding to 14:30 (local time).