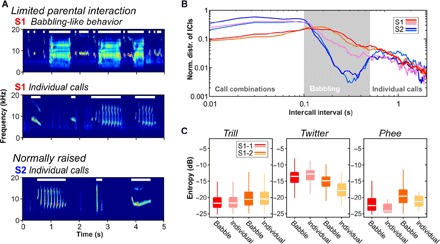
Fig. 2. Differences in vocal sequence production between S1 and S2 monkeys.

(A) From top to bottom: Spectrograms of an exemplar babbling-like sequence of an S1 monkey and exemplar vocal sequences with individual calls of an S1 and an S2 monkey, respectively. White horizontal lines indicate single calls and multisyllabic calls, respectively. (B) Relative distributions of intercall intervals (ICIs) from monkey S1-1 (red), S1-2 (orange), and S1-3 (pink), as well as S2-1 (dark blue) and S2-2 (light blue) (sliding window size, 100 ms; step size, 10 ms). (C) Median entropy distributions of trill, twitter, and phee calls made by S1-1 and S1-2 individually or during babbling-like behavior. Horizontal lines inside the boxes represent the median. Boxes represent the interquartile range (25th to 75th percentile), and whiskers indicate the 3rd and 97th percentiles.
