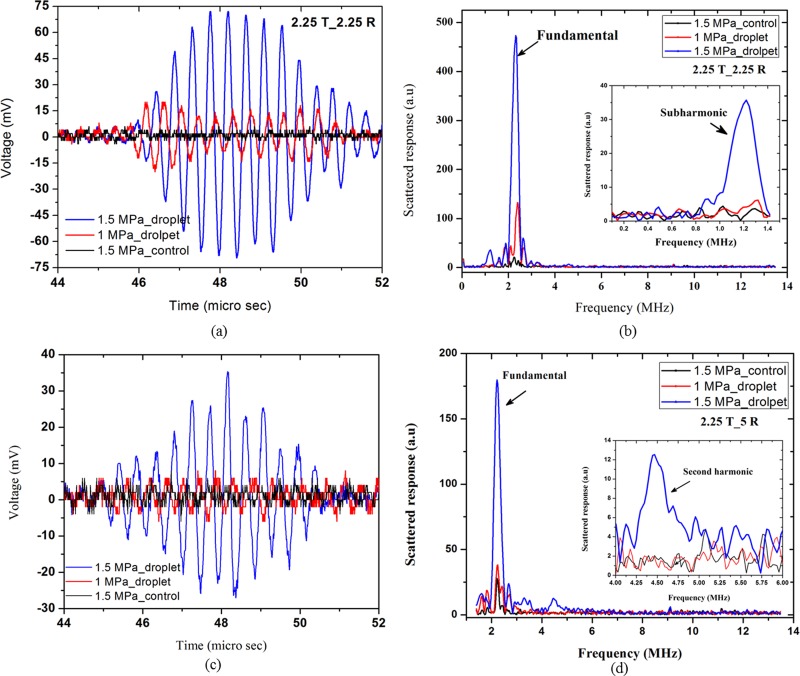
FIG. 4.
(Color online) (a) RF trace and (b) corresponding fast Fourier transform (FFT) from the control and droplet suspensions at 2.25 MHz (receiving transducer 2.25 MHz). (c) RF trace and (b) corresponding FFT from the control and droplet suspension at 2.25 MHz (receiving transducer 5 MHz). Insets of (b) and (d) show the same data but over limited frequency ranges displaying the sub- and second harmonics.

