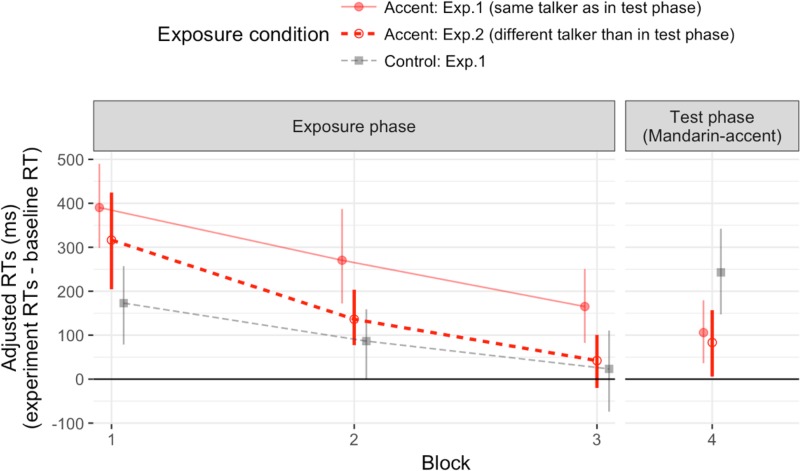
FIG. 5.
(Color online) Experiment 2 baseline-normalized RTs by exposure condition and block during the exposure and test phases. Dots indicate block means with corresponding bootstrapped 95% confidence intervals. Open circles indicate data from experiment 2. Data from experiment 1 (denoted by filled symbols and lighter lines) is plotted for comparison. The critical comparison is between the new Accent condition from experiment 2 and the Control condition from experiment 1.

