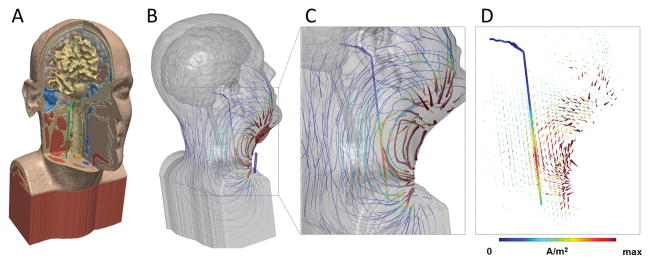
Figure 1. High-resolution model of nVNS current flow.
(A) MRI derived model including bone, brain, muscle and other soft tissue masks, and vagus nerve (green). (B) Stimulation of nVNS with electrode placement showing flux lines map gross current flow patterns through neck, with false color of local current density (>10 A/m2 max). Gross current flow patterns are determined by electrode position and anatomy. (C) Inset showing expansion of current flow around vagus nerve (1.44 A/m2 max) using the given electrode montage. (D) Arrow plots of gross current density pattern and current density on vagus nerve in false colors. The current density (proportional to electric field) along the nerve supports the prediction of activation, depending on fiber type. All models are under the quasi-static assumption with the anode in red and cathode in blue for illustration of instant direction.

