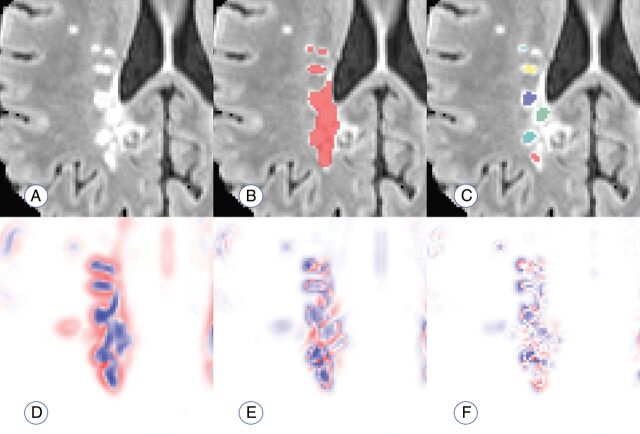
Fig 1.
Visualization of the performance of the proposed count. A, An example of a region with confluent lesion tissue. B, Connected-components method finds 1 confluent lesion in the highlighted region. C, The proposed method finds 6 distinct lesion centers in the highlighted region on the visualized axial slice. D–F, Maps of the 3 Hessian eigenvalues used to quantify lesion texture and find distinct lesion centers (red represents positive eigenvalues; blue represents negative eigenvalues).

