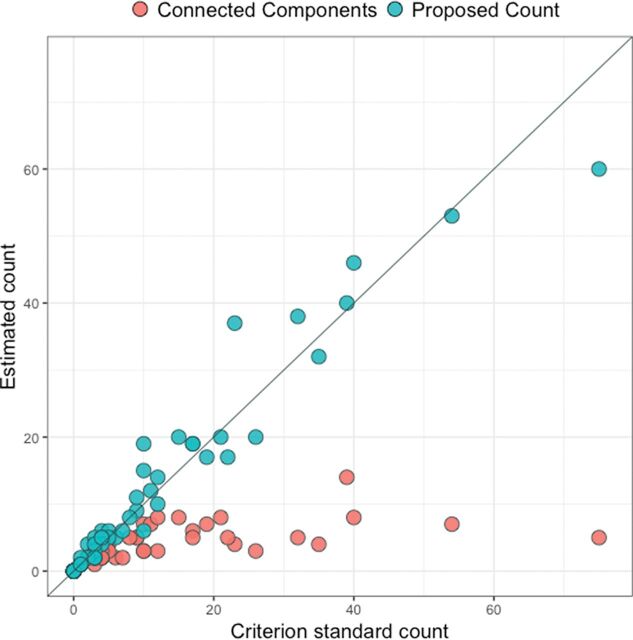
Fig 3.
Scatterplot for the comparison between the criterion standard count and the connected-components count and the comparison between the criterion standard count and the proposed count. The diagonal line represents a 1-to-1 relationship, red points represent the connected-components count, and blue points represent the proposed count.

