
Figure 2.
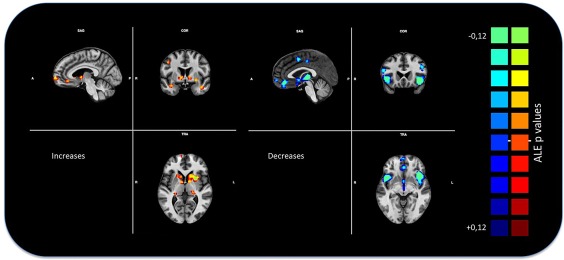
Gray matter anatomical likelihood estimation (ALE) results. The image summarizes the results of all the experiments considered in this meta‐analysis. Colors from red to yellow show gray matter increases, colors from blue to green show gray matter decreases (ALE maps were computed at a threshold of p < .001, cluster‐level corrected for multiple comparison (Eickhoff et al., 2016) and visualized using BrainVoyager QX. Only decreases have been utilized for the subsequent analysis [Color figure can be viewed at http://wileyonlinelibrary.com]