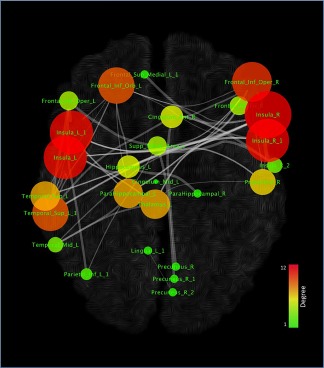
Figure 5.

Topological analysis of the morphometric co‐atrophy network. Colors and dimensions of nodes indicates their topological degree (smaller node = lower degree; from green to red = from lower to higher values) [Color figure can be viewed at http://wileyonlinelibrary.com]
