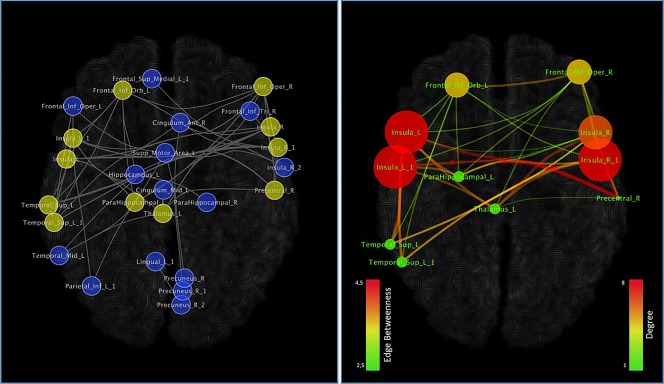
Figure 7.

Network clustering. On the basis of our data, the k‐core algorithm reported a subnetworks evidenced in the left panel (yellow nodes) and in the right panel. Colors and dimensions of nodes indicates their topological degree (smaller node = lower degree; from green to red = from lower to higher values). Colors and dimensions of edges indicates the degree of edge betweenness (smaller edge = lower degree; from green to red = from lower to higher values) [Color figure can be viewed at http://wileyonlinelibrary.com]
