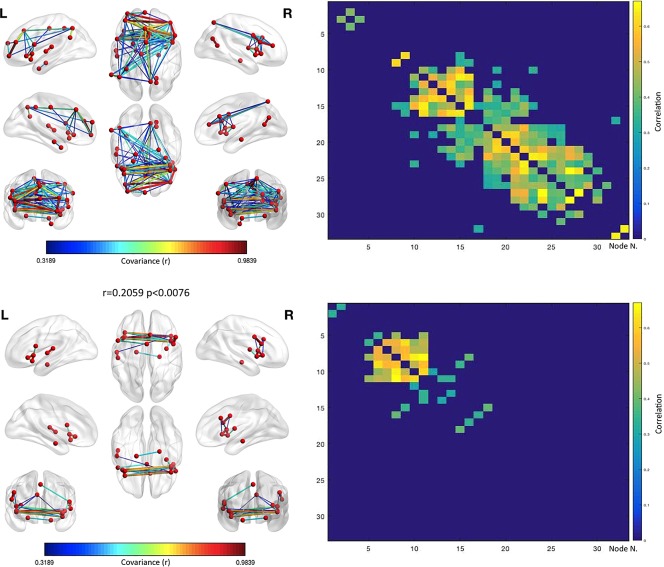
Figure 9.

Anatomical covariance results. The upper left panels shows the structural covariance network results for the same set of nodes employed in the co‐atrophy analysis. The upper right panel shows the anatomical covariance matrix. The lower left panels shows the logic AND between the co‐atrophy results and the structural covariance network results for the same set of nodes employed in the co‐atrophy analysis (i.e., the edges represented are those that are statistically significant in the co‐atrophy AND in the anatomical covariance analysis). The lower right panel shows the logic AND between the anatomical covariance matrix and the co‐atrophy co‐alteration matrix. The correlation between the two matrices is .2059 (p < .0076). Colors from blue to red indicates increasing correlation values (r) [Color figure can be viewed at http://wileyonlinelibrary.com]
