
Figure 10.
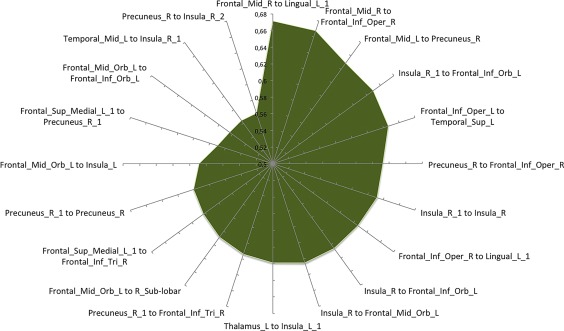
Anatomical covariance results. This graph shows the 20 edges showing the highest correlation values (i.e., the couples of most strongly structurally covariant nodes) [Color figure can be viewed at http://wileyonlinelibrary.com]
Official websites use .gov
A
.gov website belongs to an official
government organization in the United States.
Secure .gov websites use HTTPS
A lock (
) or https:// means you've safely
connected to the .gov website. Share sensitive
information only on official, secure websites.
Anatomical covariance results. This graph shows the 20 edges showing the highest correlation values (i.e., the couples of most strongly structurally covariant nodes) [Color figure can be viewed at http://wileyonlinelibrary.com]