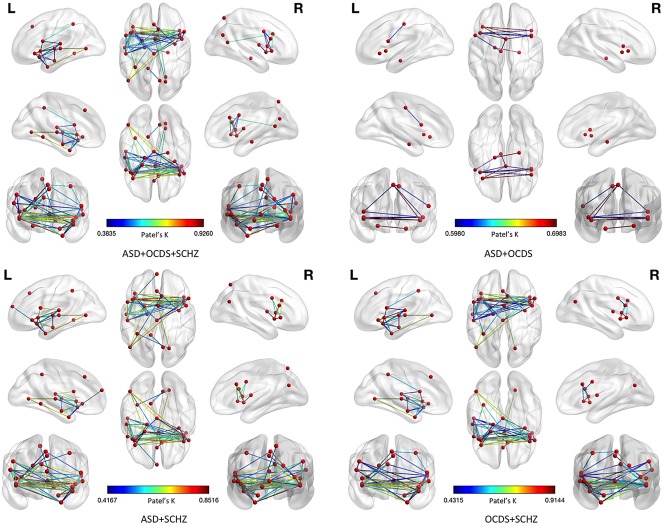
Figure 14.

Results of the morphometric co‐atrophy network by leaving one spectrum out in alternation. This figure shows the comparison between the results of the morphometric co‐atrophy network of the three spectra together (upper left panel) and each of the morphometric co‐atrophy network obtained from leaving one spectrum out in alternation. Colors from blue to red indicates increasing Patel's k values (i.e., increasing co‐alteration probabilities) [Color figure can be viewed at http://wileyonlinelibrary.com]
