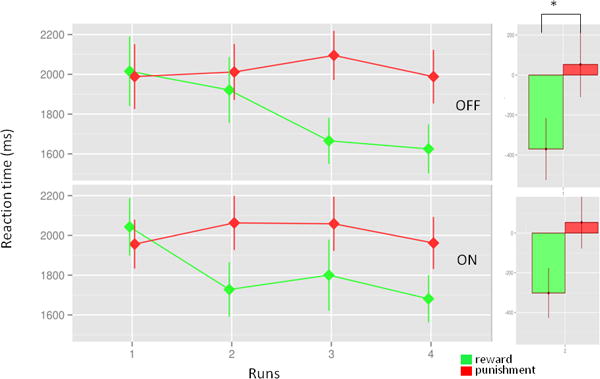
Figure 2.

Reaction time change. The figure illustrates that the reaction times decrease selectively in reward cue related trials. The chart indicates that participant learned to distinguish between the cues (reward or punishment). There was no difference across treatment conditions.
