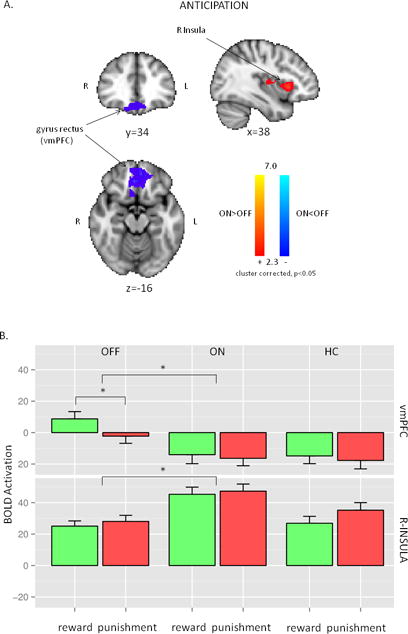
Figure 5.

A. Neuroimaging results: the main effect of treatment condition during the anticipation of the feedback. R-Insula had increased activation during ON condition, while left vmPFC (ventro-medial prefrontal cortex) had lower activation during ON condition. B. Post-hoc presentation of the significant regions of the treatment condition analysis in Figure 5A. The first two columns are OFF and ON conditions in Parkinson’s disease, while the last column represents HC. Each row represents the average values of the respective regions (vmPFC: ventro-medial prefrontal cortex, R-INSULA: right insula) from the primary analysis. The most significant differences were found between OFF and ON conditions. For more details see text.
