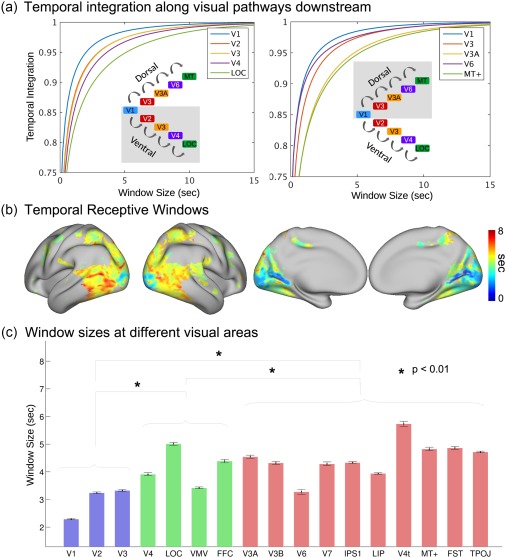
Figure 4.

Model‐estimated TRWs in the visual cortex of Subject 1. (a) The accumulation of information at different ROIs along ventral and dorsal streams. Window size represents the period to the past, and temporal integration indicates the relative amount of accumulated information. (b) The cortical map of TRWs estimated by the RNN. The color bar indicates the window sizes at individual voxels. (c) Average TRWs at individual ROIs. The blue bars represent the early visual cortex, the green bars the ventral areas, and the red bars the dorsal areas. The black error bars indicate the standard errors across voxels [Color figure can be viewed at http://wileyonlinelibrary.com]
