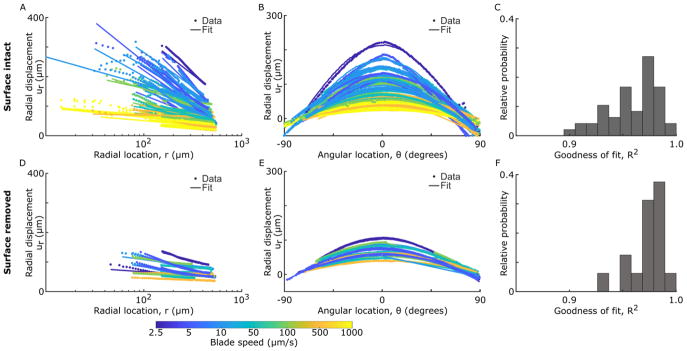
Figure 6.
Cuts of the 2D displacement data and associated 2D fits to the functional form predicted by contact mechanics (Equation 2). Data and fits are shown for (A–C) surface-intact samples and (D–F) surface-removed samples, with cuts taken (A,D) at θ = 0° and (B,E) at r = 300 μm. Color reflects blade speed. (C,F) Associated histograms of the goodness of fit (coefficient of determination) for each fit. In general, this equation fits the data well (R2>0.9), though there are larger deviations at small values of r and, for surface-intact samples, the data’s trend with θ is more sharply peaked. See Appendix D for data and fits normalized by the fitting parameters.

