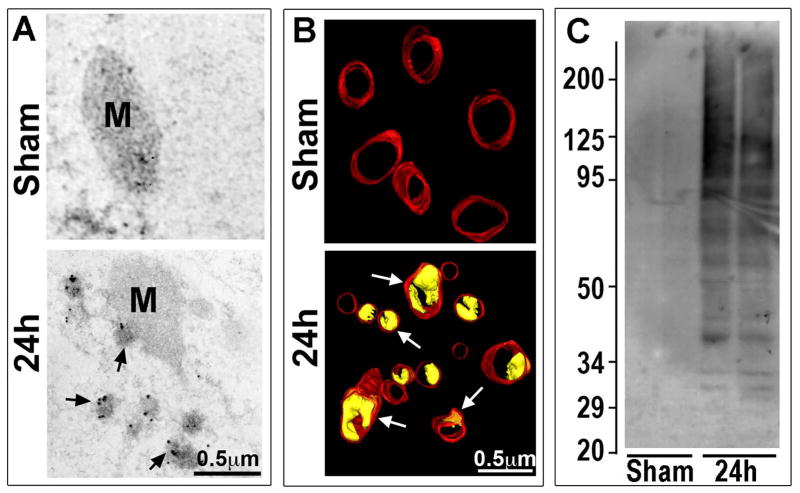
Fig. 7.
A: Ubiquitin immunogold EM micrographs of mitochondrion (M). EM micrographs of CA1 neurons from a sham-operated non-ischemic control rat and a rat subjected to 15 min ischemia followed by 24h of reperfusion. Ubiquitin immunogold labels mitochondrion and ubiquitinated protein aggregates at 24h of reperfusion (arrows). B: EM three-dimensional reconstruction of CA1 neuronal mitochondria in brain sections from sham-operated control and 24h reperfused rats. The red indicates the mitochondrial outer membrane. The yellow (arrows) represents the vacuole structures formed between the inner- and outer-mitochondrial membranes after brain ischemia. Scale bars in A and B = 0.5 μm. C: Western blotting of ubiquitin in the samples of detergent-salt insoluble mitochondrial pellets from sham-operated rats and rats subjected to 15 min of ischemia followed by 24 h of reperfusion. The molecular size is shown on the left.

