
Fig.1. Dose dependent injurious effects of lipopolysaccharide (LPS) treatment on CAPs in corpus callosum (CC) slices and protective effects of RS-LPS pre-incubation.
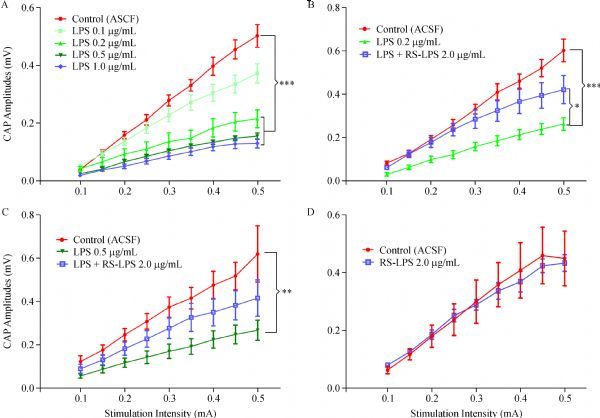
A: Input-Output response curves (I/O) summarized from CC compound action potentials (CAPs) recorded from artificial cerebrospinal fluid (ACSF) (Control), LPS 0.1, 0.2, 0.5 and 1.0 μg/mL treated slices. LPS concentrations from 0.2 to 1.0 μg/mL, but not 0.1 μg/mL, caused significant downshifts of the I/O curve against control, revealed by one-way ANOVA analysis of AUC with Dunnett's posttest to compare all groups to control (P < 0.001 in all LPS 0.2, 0.5 and 1.0 μg/mL treated slices, shown as ***). B: Downshift of I/O responsive curve by LPS 0.2 μg/mL incubation was significantly reversed by pre-treatment of CC slices with Rhodobacter sphaeroides LPS(RSLPS) 2.0 μg/mL (one way ANOVA of AUC values with Sidak's posttest: LPS vs. LPS + RS-LPS, P < 0.05, shown as *; while, the LPS group differed significantly from control (P < 0.001, shown as ***). C: downshift of the I/O curve by a higher dose of 0.5 μg/mL LPS was largely reversed by RS-LPS 2.0 μg/mL pre-treatment (one way ANOVA of AUC with Sidak's posttest: LPS vs. LPS + RS-LPS, P = 0.092); meanwhile, the LPS group against control was significant different (P < 0.01, shown as **). D: Incubation of the CC slices with RS-LPS 2.0 μg/mL alone did not significantly change the area under the I/O curve compared to the control (P = 0.962, by two-group t-test for area under the curve (AUC)).