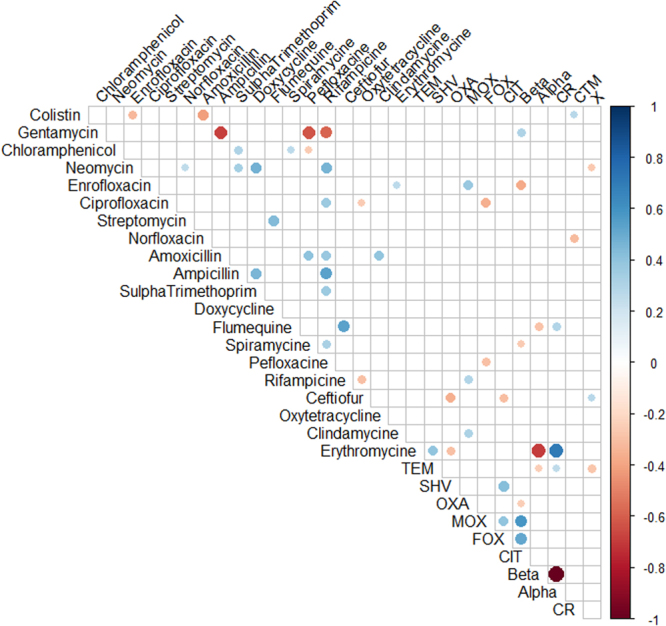
Figure 2.

Correlation matrix of phenotypic (antibiotic resistance, hemolytic activity and biofilm formation ability) and genotypic (antibiotic resistance genes) features showing significant (p < 0.05) correlations. White spaces are not significantly correlated. Blue circles indicated significant positive correlation and red show significant negative correlation. The size and strength of color represent the numerical value of the Phi correlation coefficient.
