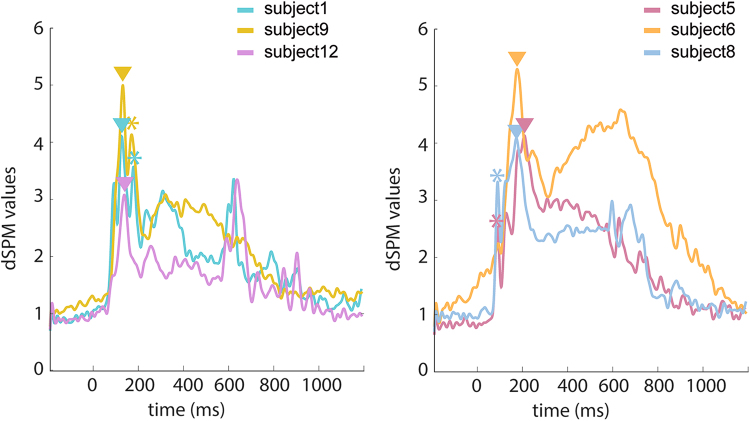
Figure 3.
Time courses from individual subjects in the calcarine fissure. (Left) Waveforms from three representative subjects showing the maximum peak between 70 ms and 130 ms and a second smaller peak between140 ms and 200 ms. (Right) Waveforms from three other subjects showing the maximum peak between 140 ms and 200 ms and an earlier smaller peak between 70 ms and 130 ms. Triangles mark the maximum peaks and asterisks mark the second largest peaks between 70 ms and 200 ms in the time courses, respectively.

