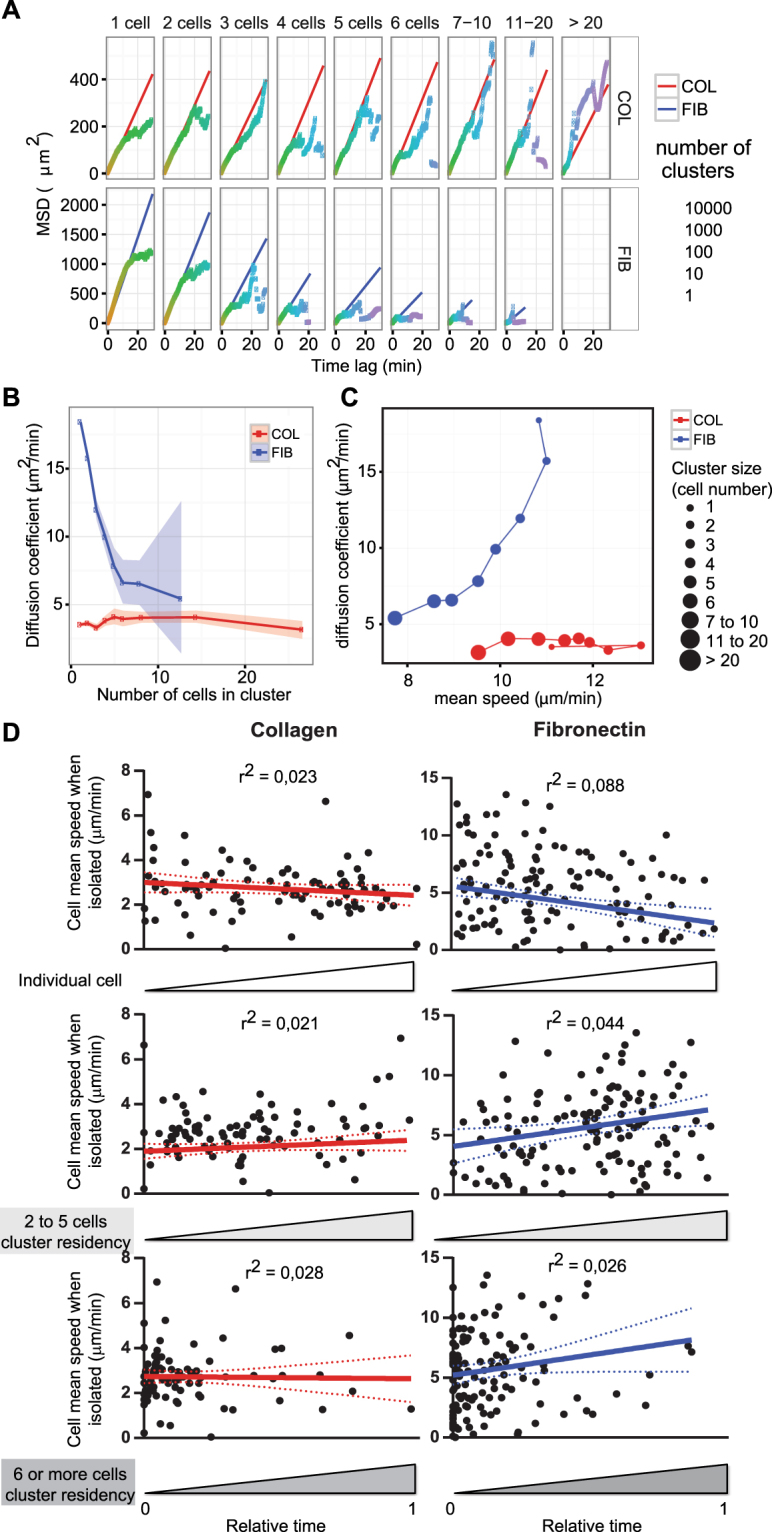
Figure 5.

Emergence of B lymphocyte collective motion properties depends on matrix interaction. (A) Mean square displacement was plotted as a function of time interval for JY cell clusters of growing size tracked at high cell density over collagen IV and fibronectin. Linear regressions and shown in red or blue, respectively. The color code indicates the number of tracks available for each time length. Data were pooled from 10 videos per condition. (B) Diffusion coefficient of each cluster category represented with confidence interval. (C) Correlation between diffusion coefficient and mean speed (time lag of 5 s) is shown for clusters of each category. (D) JY-GFP cells diluted 1/40 with unstained JY cells, seeded at high cell density over collagen IV or fibronectin and imaged after 6 h for another 6 h, each 30 s. GFP cells were automatically tracked and their time as isolated cells or as part of clusters were quantified. The plots represent the mean speed of each cell as it migrated alone, as a function to the relative time of those cells as isolated cells, as part of small clusters or as part of large clusters. Linear regression and 95% confidence interval were plotted (collagen IV, 90 cells; fibronectin, 132 cells; data from one representative experiment out of 3). See also Supplementary Figure S4 and Video S6.
